 Download slides
Truckload costs climb as capacity tightens
Published: Thursday, April 09, 2026 | 09:00 am CDT
Onthispage
Given the recent turmoil in the marketplace, many shippers have been asking similar questions to try to understand appropriate next steps to take. Below is a compilation of questions along with brief responses, including links to resources to explore deeper.
Recent frequently asked questions
What should shippers consider during periods of fuel volatility?
Attempting to predict future fuel prices is rarely an effective way to manage near‑term fuel spend. A more productive approach is to focus on strategies that help mitigate fuel exposure regardless of price direction, along with scenario planning for decisions and associated actions at certain fuel price levels. These can include operational adjustments, routing decisions, and contractual structures that reduce sensitivity to fuel swings. This informative fuel white paper can help shippers evaluate practical options for managing fuel costs without introducing unintended consequences.
What should I know if reconsidering a truckload (TL) procurement strategy?
There are various factors to consider, such as lane segmentation, capacity strategy, provider mix, duration of bid, service expectations, and more. Even seemingly minor factors, such as inconsistent bid cycles, can influence pricing by introducing uncertainty into carrier rate planning. To ensure you are making the right decision regarding your procurement process, reviewing research-based insights on procurement strategies is highly recommended.
As capacity tightens, how can shippers entice carriers to choose their freight over others?
Tightened capacity means more options for carriers. Rates are one lever to ensure coverage, but there are others that can affect how attractive a shipment is to carriers highlighted in this Shipper of Choice white paper.
What are some easy ways to decrease truckload rates?
Savings on freight rates can come from several different actions. Some require advanced network analysis or routing optimization, while others are simpler operational adjustments. Providing increased lead time is often one of the most effective and overlooked levers, as it expands the pool of available capacity and improves pricing outcomes.
Is truckload to intermodal conversion to save on fuel worth it?
There are various factors to consider—such as costs, transit-times, and sustainability—when contemplating modal conversion. Several small and medium-sized businesses have been shifting to intermodal over the past several months to take advantage of cost savings and create resiliency in their network.
Why does it seem California, Texas, and Arizona are tighter than the rest of the market?
California, Arizona, and Texas are three regions where structural constraints are tightening spot conditions beyond national averages. In California, outbound demand remains elevated relative to available truck supply, while diesel prices - running roughly 40% above the national average - have materially increased carrier cost per mile and driven higher tender rejections as contract fuel programs lag real-time inflation.
In Texas, capacity constraints are being driven less by demand and more by enforcement intensity and border area compliance scrutiny, prompting carriers to selectively service—or avoid—certain lanes unless pricing compensates for increased risk and uncertainty. Arizona lanes, particularly in the south, are seeing similar cost pressure compounded by heightened regulatory and inspection activity that is lengthening turn times and reducing effective capacity.
Across all three markets, these dynamics are changing carrier behavior, requiring higher spot prices to secure reliable coverage and amplifying service and cost volatility as seasonal demand builds.
How can carriers manage fuel cash flow during periods of high prices?
Diesel fuel prices have surged, creating real strain across the carrier community—and that pressure ultimately impacts our customers. To help ease cash flow pressure, cash advance fees on C.H. Robinson fuel card transactions have been waived for a limited time, allowing carriers to keep more working capital on hand.
How can shippers stay informed about critical freight disruptions, such as ocean vessel diversions?
Major disruptions can impact freight markets quickly, often well before scheduled market updates are published. To stay aligned with rapidly changing conditions, shippers can register for client advisory updates that provide timely insights on events such as vessel diversions, port disruptions, GRIs and emergency surcharges, and other developments that may affect supply chains.
What is the latest on USMCA negotiations, and how should shippers prepare while talks are underway?
Negotiation discussions have introduced uncertainty around future trade rules, enforcement, and potential cost impacts. Shippers should monitor developments closely and focus on maintaining flexibility in sourcing, routing, and capacity strategies as talks progress, with additional context available in this USMCA blog.
What is the current status of tariff refunds, and what should shippers expect next?
Tariff refund activity has progressed more slowly than many shippers have hoped, with timelines varying based on eligibility and documentation requirements. Further details considerations regarding tariff refunds are revealed as clarity is known.
U.S. spot market
The market appears to be entering a phase of supply‑driven tightening in truckload freight. The significant cost pressures and elevated levels of market stress being observed during a seasonally soft period are necessitating another increase to the full 2026 cost curve. This shift is being driven primarily by supply‑side factors, including CDL and other enforcement actions.
From a macro perspective, there are emerging signs of improvement in certain industrial end markets—including data center buildouts and related energy infrastructure, in addition to some manufacturing‑related capital expenditures—that is somewhat offset by slightly softer consumer spending. Higher gasoline prices present a risk of crowding out discretionary spending, though higher tax refunds may provide some offset in the near term.
As a result, full year 2026 cost expectations for both dry van and refrigerated truckload have been revised upward. Dry van costs are now projected to increase approximately 17% year over year (y/y) while refrigerated costs are forecast to rise roughly 16% y/y. This revision incorporates a higher projected cost floor and a firmer second half trajectory due to a more persistent and structural supply imbalance than had previously been anticipated.
Upcoming compliance and enforcement events are adding to an already constrained capacity landscape. DOT Roadcheck Week, for example, scheduled for May 12-14, brings additional execution risk at a time when carrier availability is already limited. Roadcheck week was disruptive in 2025, and we expect a similar impact this year.
Recent diesel price increases have caused carrier dislocations but are not the primary driver behind the forecast revision. Instead, the increase is centered on rising operating costs and reduced elasticity in carrier and driver availability, which are limiting the market’s ability to normalize aftershocks, even during traditionally weaker periods.
This outlook does not assume a material improvement in freight volumes during the second half of 2026 beyond normal seasonal patterns. The potential impact of improving demand or an inventory rebuild in the second half of the year creates significant upside tension to this forecast. Conversely, a sustained softening in consumer demand would translate into weaker freight volumes and could temper cost pressure later in the year.
For shippers, this environment underscores the importance of realistic budgeting assumptions, proactive carrier engagement, and an understanding that traditional seasonal cost relief may be less reliable as structural supply dynamics take hold.
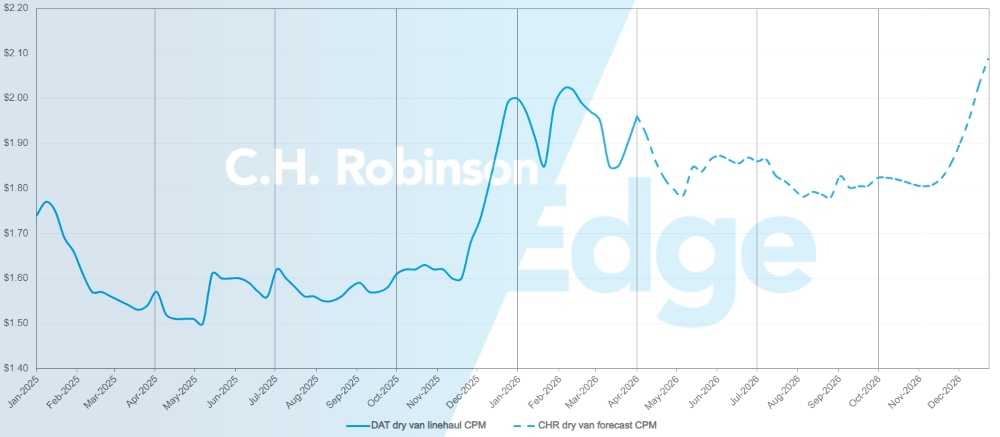
U.S. spot market forecast: Dry van truckload
The C.H. Robinson 2026 dry van cost per mile forecast is being increased to 17% y/y.
C.H. Robinson spot market dry van truckload forecast
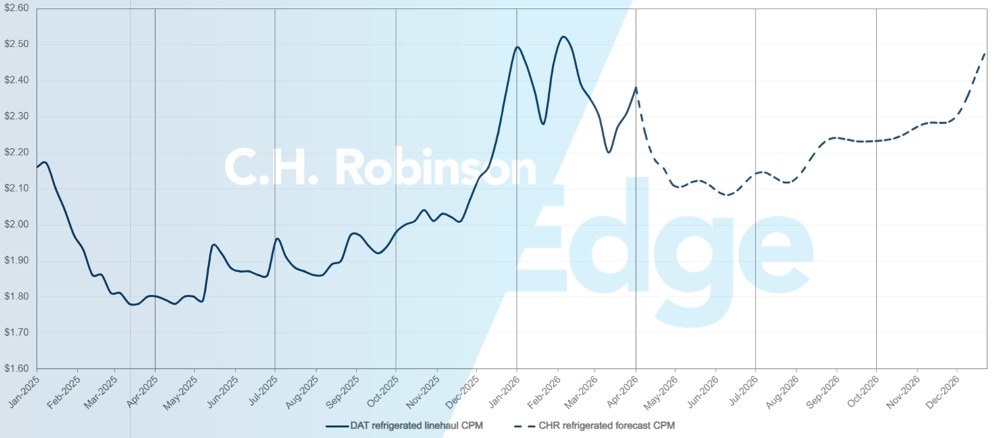
U.S. spot market forecast: Refrigerated truckload
The C.H. Robinson 2026 refrigerated van cost per mile forecast is being increased to 16% y/y.
C.H. Robinson spot market refrigerated truckload forecast
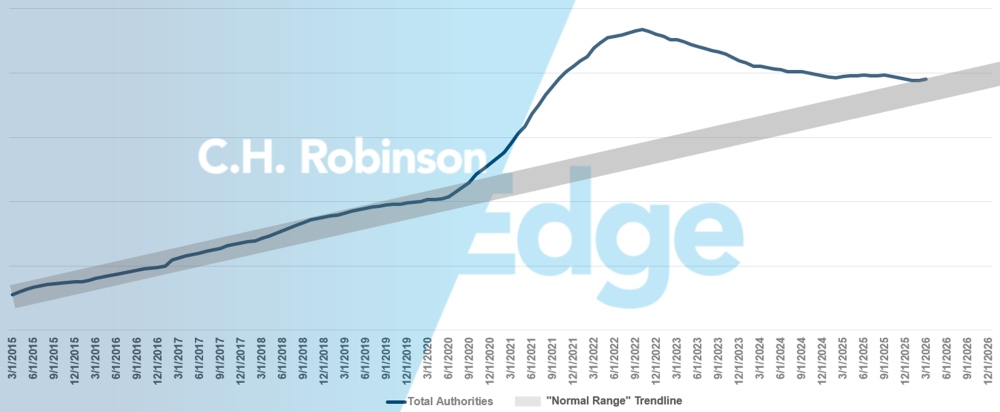
For-hire carrier authorities forecast
Prior to 2020, the number of carrier authorities in the U.S. remained within a normally expected range regardless of market cycle. During the Covid-era freight boom, the U.S. truckload market saw a record number of entrants, which has gradually been declining since 2022. Based on the current pace of carrier attrition, carrier authority counts have now returned to the high-end of the normal range of carriers to support the U.S. economy.
For-hire carrier forecast
Contract truckload environment
The following insights are derived from C.H. Robinson Managed Solutions™, which serves a large portfolio of customers across diverse industries.
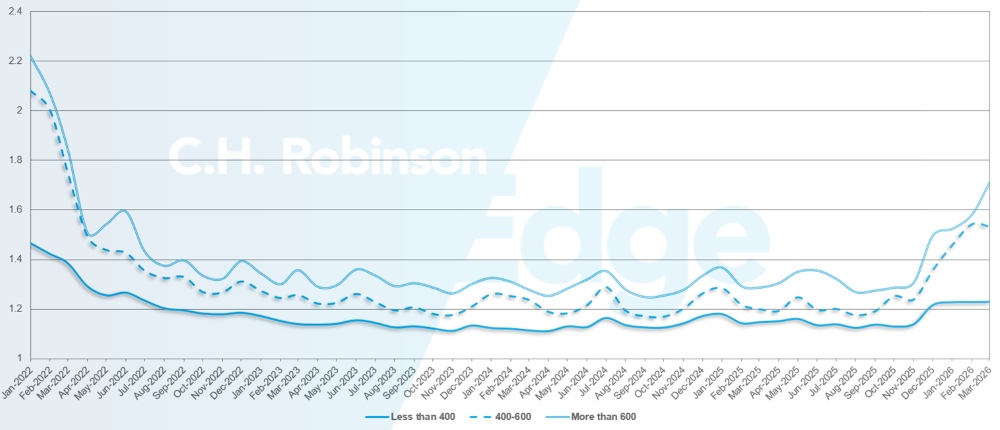
Route guide depth (RGD) is an indicator of how far a shipper needs to go into their backup strategies when awarded transportation providers reject a tender. An RGD of 1.0 would be perfect performance, and 2.0 would be extremely poor. Route guide failures are when the route guide has been exhausted with no acceptance, sending the shipment into the spot market.
As displayed in the following chart, the RGD had remained flat at a historically low level for approximately three years after a high of more than 2.2 in 2022. Beginning in late November 2025, the first signs of a changing market showed up as route guide depth surpassed 1.3 for the first time in years and failures increased to ~5%. Since then, route guides have remained challenged due to a series of winter storms against a backdrop of decreasing capacity.
For the month of March, route guide depth across all North America shipments was 1.41, worse than the previous month of 1.38.
From a mileage perspective, long hauls of more than 600 miles had a route guide depth of 1.71 in March, which is worse compared to the prior month of February 2026 at 1.58, and worse compared to March 2025, which was at 1.28. For shorter hauls of less than 400, miles the route guide depth for March 2026 was 1.23, which is flat compared to the previous month, but worse than March 2025 at 1.11.
North America route guide depth metrics: By length of haul
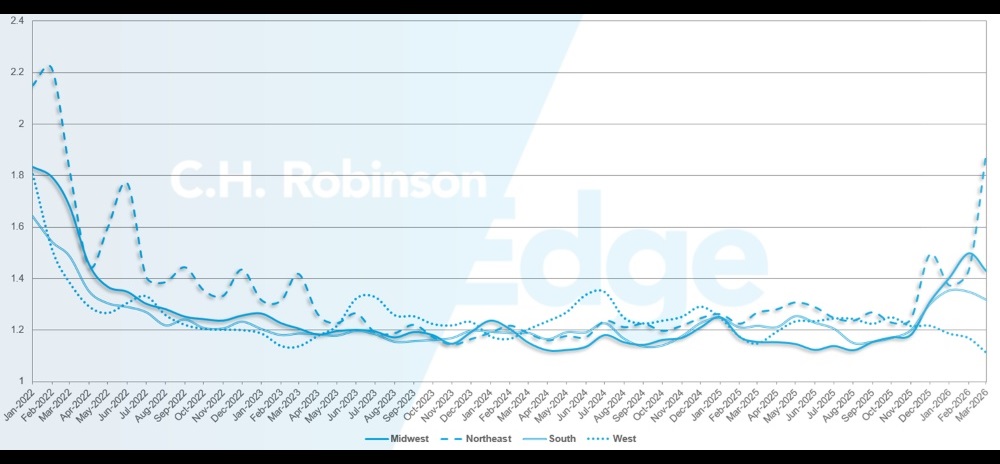
Geographically, the South experienced the smallest change of all regions, improving by 2.4% from the previous month, while the Northeast experienced the largest change, worsening by 24%. The RGD varies greatly between low levels of 1.11 and highs of 1.89 for all regions.
U.S. route guide depth metrics: By region
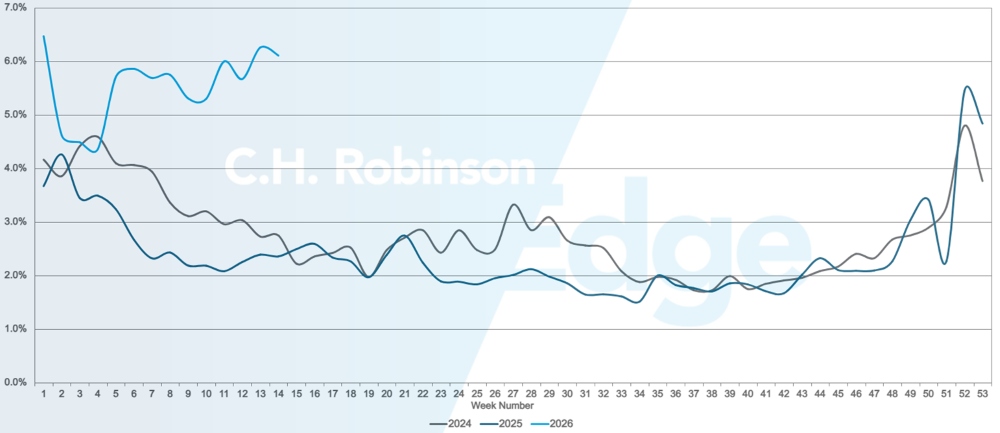
U.S. route guide failures
Refrigerated truckload
East Coast United States
Across the East Coast, conditions are tightening, particularly in major metro markets. Atlanta and Philadelphia are showing the most pronounced pressure, with load‑to‑truck ratios running well above typical levels. Same‑day freight is moving more slowly and at significantly higher cost, reflecting both tighter capacity and increased carrier selectivity in these lanes.
From a produce perspective, weather disruptions are also influencing seasonal flows. A February freeze delayed harvest timelines in South Florida, pushing back readiness across several product categories. As a result, higher Florida produce volumes are now expected to move in mid to late April, roughly one month later than typical seasonality.
This delayed ramp is likely to compress peak volumes into a shorter window, increasing competition for capacity as produce season accelerates. Shippers with exposure to East Coast metros or Florida outbound lanes may face elevated spot costs and should plan accordingly, particularly for time‑sensitive or short‑notice moves.
Central United States
The Upper Midwest remains modestly tight, with rates running above forecast. Capacity is generally available, but pricing continues to be the primary constraint rather than physical availability. Arkansas, Missouri, and Kansas are exhibiting similar conditions, with same‑day and short‑notice freight moving at elevated rate levels as carriers price in tighter utilization.
The Dallas market remains both elevated and tight, with costs running higher y/y and above forecasted levels. South Texas is experiencing even more pronounced pressure, with rates at very elevated levels across multiple lanes.
Rising fuel costs and a growing share of freight shifting into the transactional market are having a meaningful impact across these regions. As volumes move away from contracted commitments and into spot or short‑term coverage, carriers are increasingly pricing to reflect real‑time cost exposure, contributing to sustained rate pressure. Shippers operating in these markets may face continued volatility and should plan for higher marginal costs when securing capacity, particularly on time‑sensitive or irregular moves.
West Coast United States
A similar outlook is emerging on the West Coast, where market conditions remain tight across all major origin points. Los Angeles, Yuma, Nogales, and Washington are all experiencing significant pressure, reflected in notably elevated load‑to‑truck ratios. Demand has also been increasing out of California, driven by typical seasonal factors such as cross‑border produce flows and produce volumes ramping within the state.
Port activity has also increased in recent weeks following the Lunar New Year period in China, which typically results in a post‑holiday surge in vessel departures. Given transit times to the U.S. West Coast, that activity is now arriving and adding to freight demand.
Rising fuel costs are having an outsized impact in this region, with diesel prices in many West Coast markets over $7 per gallon. These higher fuel inputs are flowing directly into carrier cost structures and are increasingly being reflected in spot and short‑term pricing.
Looking ahead, tightness in both rates and capacity is expected to persist over the coming weeks. California produce volumes are ramping up as the state’s season begins, and the transition from Yuma to Salinas is set to start shortly. This overlap is likely to intensify competition for capacity on key outbound lanes, particularly for time‑sensitive freight. Shippers with West Coast exposure may benefit from early planning and flexible routing strategies as seasonal demand and elevated operating costs converge.
Flatbed truckload
Stresses in the flatbed market persisted through March, as tightening capacity and rising demand created a more competitive environment for securing trucks. A key driver behind these conditions remains the steady reduction in flatbed capacity over the past three years. With fewer trucks available, even modest increases in demand are having a more pronounced impact on overall market dynamics.
Demand signals across traditional flatbed sectors remain mixed. Activity in the building products and housing segments has shown only slight improvement, with similar trends observed in the energy sector. The NAHB/Wells Fargo Housing Market Index edged up to 38 in March, from 37 in each of the previous two months, but remains one point below previous year’s levels, reflecting continued caution in residential construction.
Industrial activity, however, has provided more consistent support. U.S. industrial production rose to 102.5 in February, its highest level since August 2019 and now above pre-pandemic levels. While the increase from 2024 levels has been modest, it signals a continued recovery in industrial output. Data center construction in particular has played a meaningful role in supporting related flatbed freight demand.
Market indicators reflect these underlying conditions. Flatbed load-to-truck ratios have climbed over 80 to 1, with the Southeast and Midwest experiencing the most tightening. Flatbed capacity has worsened over 30% month over month, and by nearly 100% since January. Spot rates have also trended higher, rising over 20% in March compared to January.
As the market moves further into the spring construction season, elevated conditions are likely to persist. Industrial demand remains relatively strong, and capacity continues to operate at reduced levels compared to prior years. As a result, even moderate freight growth can tighten conditions quickly. Regional pressure is expected to remain most pronounced in the Southeast and Midwest, with the North beginning to follow as seasonal weather improves and construction activity ramps up.
In this environment, planning and flexibility remain critical to maintaining service and managing costs.
- Increasing lead times where possible can improve coverage, as same-day and short-notice shipments are becoming more difficult to secure.
- Allowing flexibility in pickup windows and ship dates can expand available carrier options.
- Broadening equipment flexibility, where feasible, can also support coverage. Utilizing step decks or Conestoga trailers in addition to standard flatbeds may increase available capacity.
- Transit expectations can influence coverage. Longer-haul freight often moves more efficiently later in the week, while short-haul shipments can become more constrained on Fridays as carriers prioritize loads that best position their networks for the weekend.
Maintaining close coordination with a C.H. Robinson account manager can help monitor regional shifts and position freight more effectively in a tightening market.
Voice of the Carrier
Market
- Capacity is tightening as carriers remain cautious on fleet growth after prolonged downsizing.
- Spot market rates are showing early signs of upward movement, though a full market shift has not yet occurred.
- Carriers are prioritizing profitability, exiting unprofitable lanes and enforcing stricter pricing discipline.
Drivers
- Driver availability is tightening, making recruiting more difficult than in recent months.
- Wage pressure is building as carriers look to retain and attract quality drivers.
- Regulatory changes are contributing to driver attrition and limiting new supply.
Equipment
- Fleet growth remains constrained, with carriers hesitant to reinvest without sustained demand improvement.
- Network imbalances and trailer constraints are contributing to service challenges.
- Fuel volatility is creating cost pressure and forcing adjustments to surcharge strategies.
 Actionable freight insights