 Download slides
Holidays affect truckload capacity and new 2026 forecasts
Published: Thursday, December 11, 2025 | 09:00 AM CDT
Onthispage
U.S. spot market
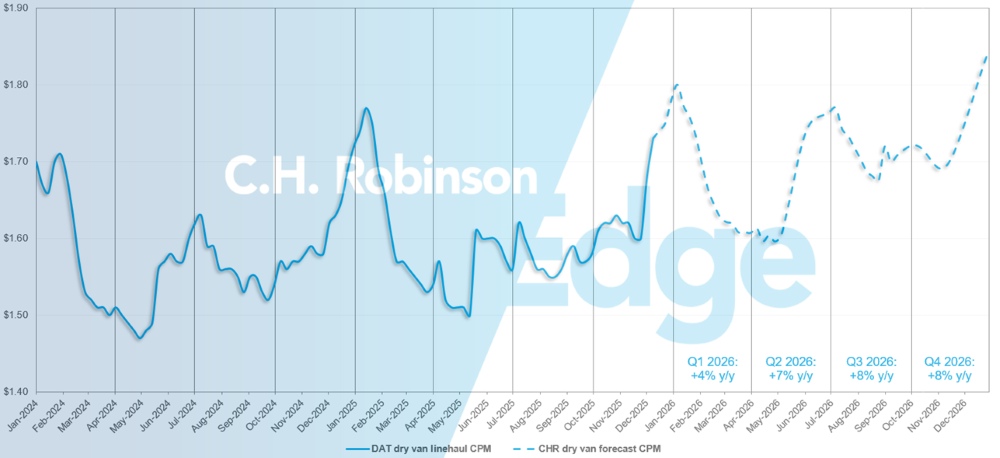
C.H. Robinson has increased the 2026 dry van truckload rate forecast from 4% year over year (y/y) growth to 6% growth y/y. The increase is driven by the supply side of the market: Capacity is tighter than expected post-Thanksgiving and with only a few weeks left in the year, rate increase impacts will roll through into 2026.
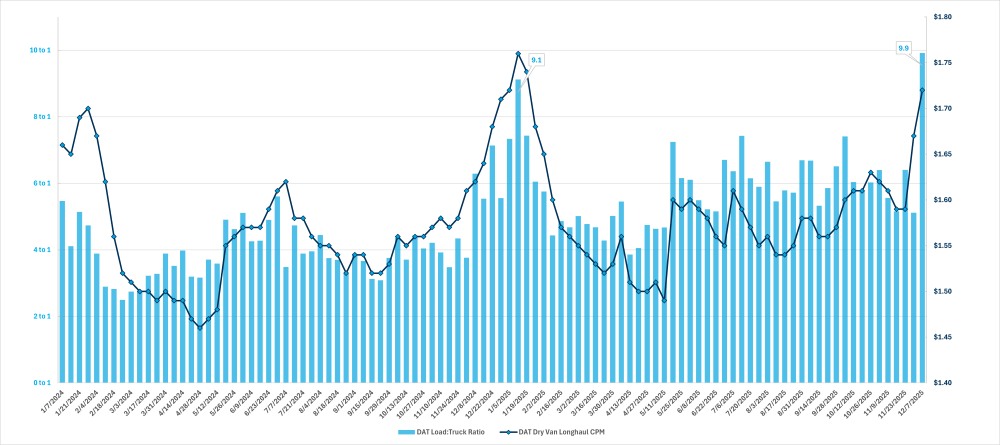
Some weather events around Thanksgiving contributed to this change and there is a normal seasonal decline in available capacity from Thanksgiving into year end. But the DAT load-truck-ratio spiked to 9.9-to-1 the week ending 6 December 2025. This was the highest of the current truckload downcycle and higher than the 9.1-to-1 ratio the week ending 11 January 2025 (see chart), which was driven by year-end carrier exits, holidays and even more severe weather.
This decline of available capacity into year-end is more pronounced than in recent years and exacerbated by heightened scrutiny and enforcement of commercial driver’s licence (CDL) eligibility, which we expect to have an impact through 2026.
National weekly DAT load to truck ratio and cost/mile
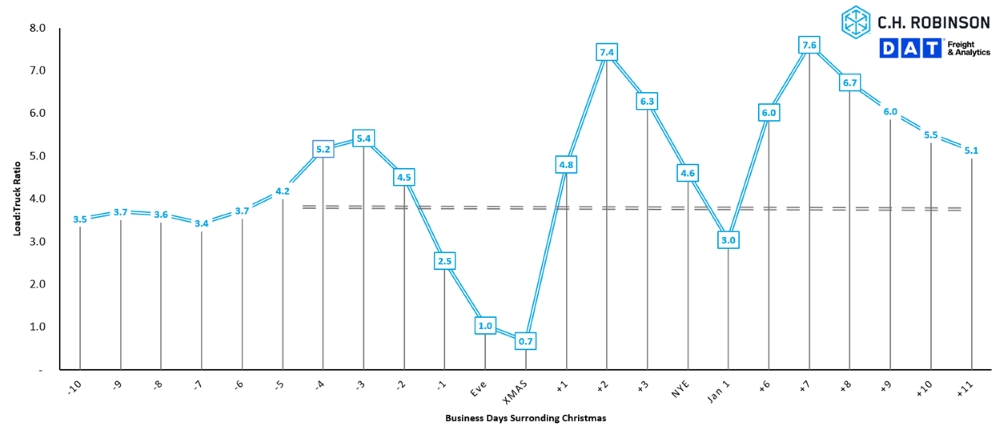
As illustrated in the chart below, this typical seasonal trend includes a tightening of capacity before Christmas and between Christmas and New Year’s. While some days show a decrease in the load-to-truck ratio, this isn’t indicative of better capacity, but rather a large decrease in load and truck postings that skew the ratio.
Given the large decrease in available trucks over the holidays, costs will likely remain elevated during this time. Rescheduling pickup days or providing ample lead time will help to mitigate cost increases.
Christmas 10-year load:truck ratio impact
U.S. spot market forecast: Dry van truckload
The C.H. Robinson 2026 forecast is being increased to +6% year over year (y/y).
C.H. Robinson spot market dry van truckload forecast
U.S. spot market forecast: Refrigerated truckload
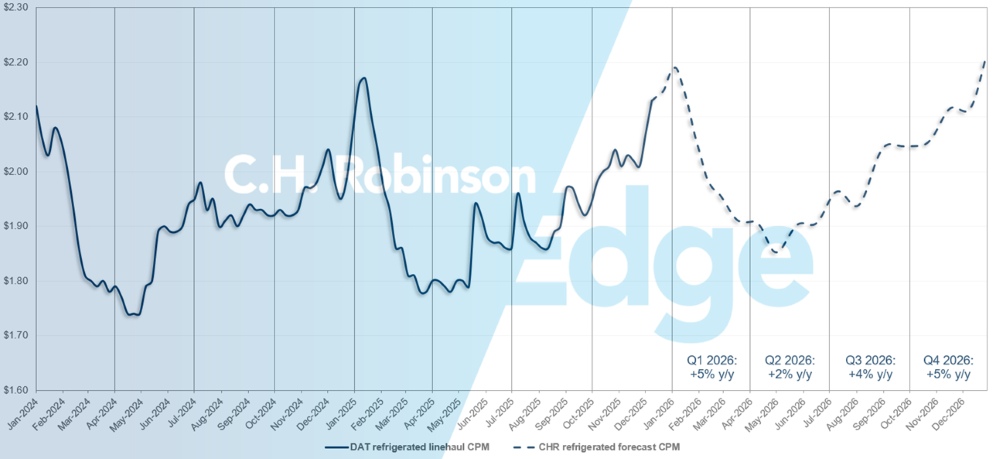
The C.H. Robinson 2026 refrigerated truckload forecast is being increased to +5% y/y.
C.H. Robinson spot market refrigerated truckload forecast
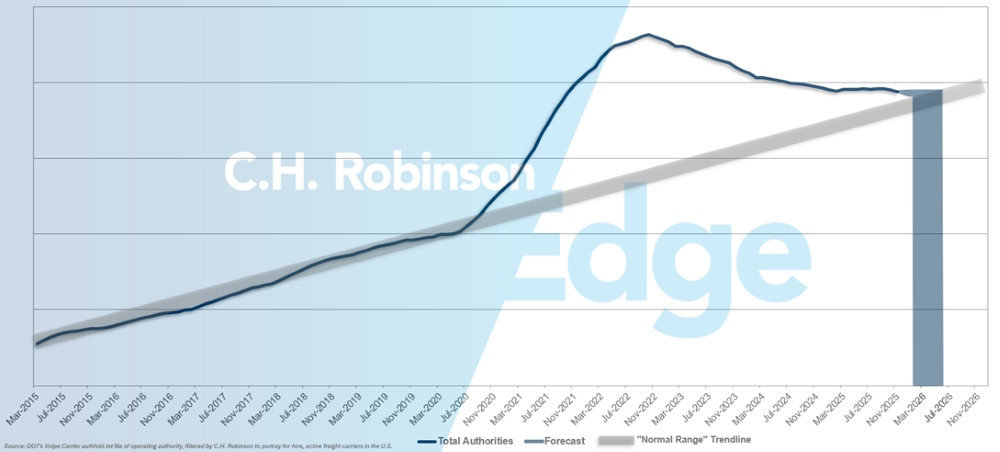
For-hire carrier authorities forecast
If the current pace of U.S. carrier attrition continues, carrier authority counts would return to historical levels in early 2026, possibly later.
For-hire carrier forecast
Contract truckload environment
The following insights are derived from C.H. Robinson Managed Solutions™, which serves a large portfolio of customers across diverse industries.
Route guide depth is an indicator of how far a shipper needs to go into their backup strategies when awarded transportation providers reject a tender. 1 would indicate perfect performance and 2 would be extremely poor. As displayed in the following chart, route guide depth has remained flat at a historically low level for approximately two years.
For the month of November, route guide depth across all North America deliveries was 1.19, flat compared to the previous month.
From a mileage perspective, long hauls of more than 600 miles had a route guide depth of 1.29 in November, which is worse compared to the prior month of October 2025 at 1.19 and worse compared to November 2024, which was at 1.17. For shorter hauls of less than 400 miles the route guide depth for November 2025 was 1.13, which is slightly better than the previous month of 1.14 but slightly worse than November 2024 at 1.12.
North America route guide depth metrics: By length of haul

Geographically, the South experienced the smallest change of all regions, worsening by 1.4% from the previous month, while the Northeast experienced the largest change, improving by 3.3%. Route guide depth still remains at low levels between 1.17 and 1.25 for all regions.
U.S. route guide depth metrics: By region

Refrigerated Truckload
East Coast United States
The East Coast continues to follow typical seasonal trends, with modest holiday-driven volume increases. The first major winter storm of the season briefly tightened capacity in the Northeast, but impacts were short-lived. Barring additional severe weather, market conditions are expected to remain normal.
In the Southeast, conditions are also tracking with seasonal norms. Increased produce movement from Florida and south Georgia is adding some volume but is not materially affecting overall market balance. As the holidays approach, shippers should anticipate pockets of capacity tightening, particularly for last-minute freight across the region.
Central United States
The Midsouth has available capacity, but rates remain elevated. Clean, simple freight with one pickup and one delivery is moving the quickest and that trend should continue into early 2026. In the central states of Missouri, Indiana, Arkansas and Kansas, capacity is also available, but same-day rates are running high.
The Dallas area still has readily available capacity, with pricing being the main factor. South Texas remains loose for now, though conditions are expected to tighten closer to Christmas and New Year’s. Weather remains the biggest wildcard, especially snow in the Midwest and any ice or winter weather across Arkansas, Oklahoma or Texas.
West Coast United States
The West region continues to see steady capacity, with little change over the past several weeks. Even with capacity holding, rates have pushed higher out of both Southern California and the Pacific Northwest. Last-minute holiday and holiday-adjacent loads remain the most expensive, especially for temperature-controlled freight that requires tighter service. Moving through the season, expect the market to stay manageable on capacity but firm on pricing, particularly for urgent or weekend-to-holiday pickups.
Flatbed truckload
One strong segment of flatbed freight comes from the housing industry and the Housing Market Index is one view of that industry’s health. While the latest reading showed a 15.6% increase, the index is still more than 20% below what’s considered neutral and 14% lower than a year ago. That gap reflects continued caution in residential construction. Without meaningful changes to federal interest rates, a notable rebound in housing activity—and by extension flatbed demand—remains unlikely in the near term.
Flatbed spot rates began to level off in October, ending a five-month slide, then spiked at the end of November. Market indicators point to broad stability, but seasonal patterns are starting to set in as winter approaches. Capacity typically tightens in northern and mountainous states as carriers work to avoid snow and ice, which can lead to limited willingness to haul into those areas and higher rates. These are localised pressures rather than structural ones, but regional fluctuations will become more noticeable through December.
Overall, trends continue to track with the five-year average, with capacity expected to tighten in the final weeks of December as some drivers step away for the holidays.
As winter progresses, flexibility and strong lead times remain the best way to navigate predictable tightening in weather-sensitive lanes. Considering alternate routes, wider pickup windows or equipment flexibility can help to reduce disruptions. Staying connected with your C.H. Robinson representative is the most effective way to stay ahead of regional shifts, understand exposure to winter-affected markets and make proactive adjustments that support consistent service and cost performance through year-end.
Voice of the Carrier
Observations from a cross-section of the contract carriers in the C.H. Robinson network:
Market
- Carriers continue to report weak and inconsistent demand, noting that meaningful recovery will require additional capacity to exit the market.
- Bid season has seen more activity this year than last year, with carriers saying most shippers are settling into reasonable rate adjustments.
Cost controls
- Rising operational expenses remain a major concern. Carriers are focused heavily on cost control, efficiency gains and new revenue opportunities.
Equipment
- There is a lack of initiative to grow overall fleet size in the near term.
- While some carriers have been able to maintain their regular cycle of replacing old equipment with new, others are delaying, citing high costs for new tractors.
 Actionable freight insights